
Why schools on opposite sides of the same city get different funding
Two classrooms in the same postcode can receive vastly different budgets, driven by a complex system of social weightings and historical quirks.
Two schools in the same city, sitting just a few miles apart, can receive thousands of pounds more per pupil than their neighbours. This gap is not an administrative mistake, nor is it down to favouritism by local councillors. It is the deliberate result of a complex, highly mathematical system of "weightings" designed to direct money where it is deemed most needed.
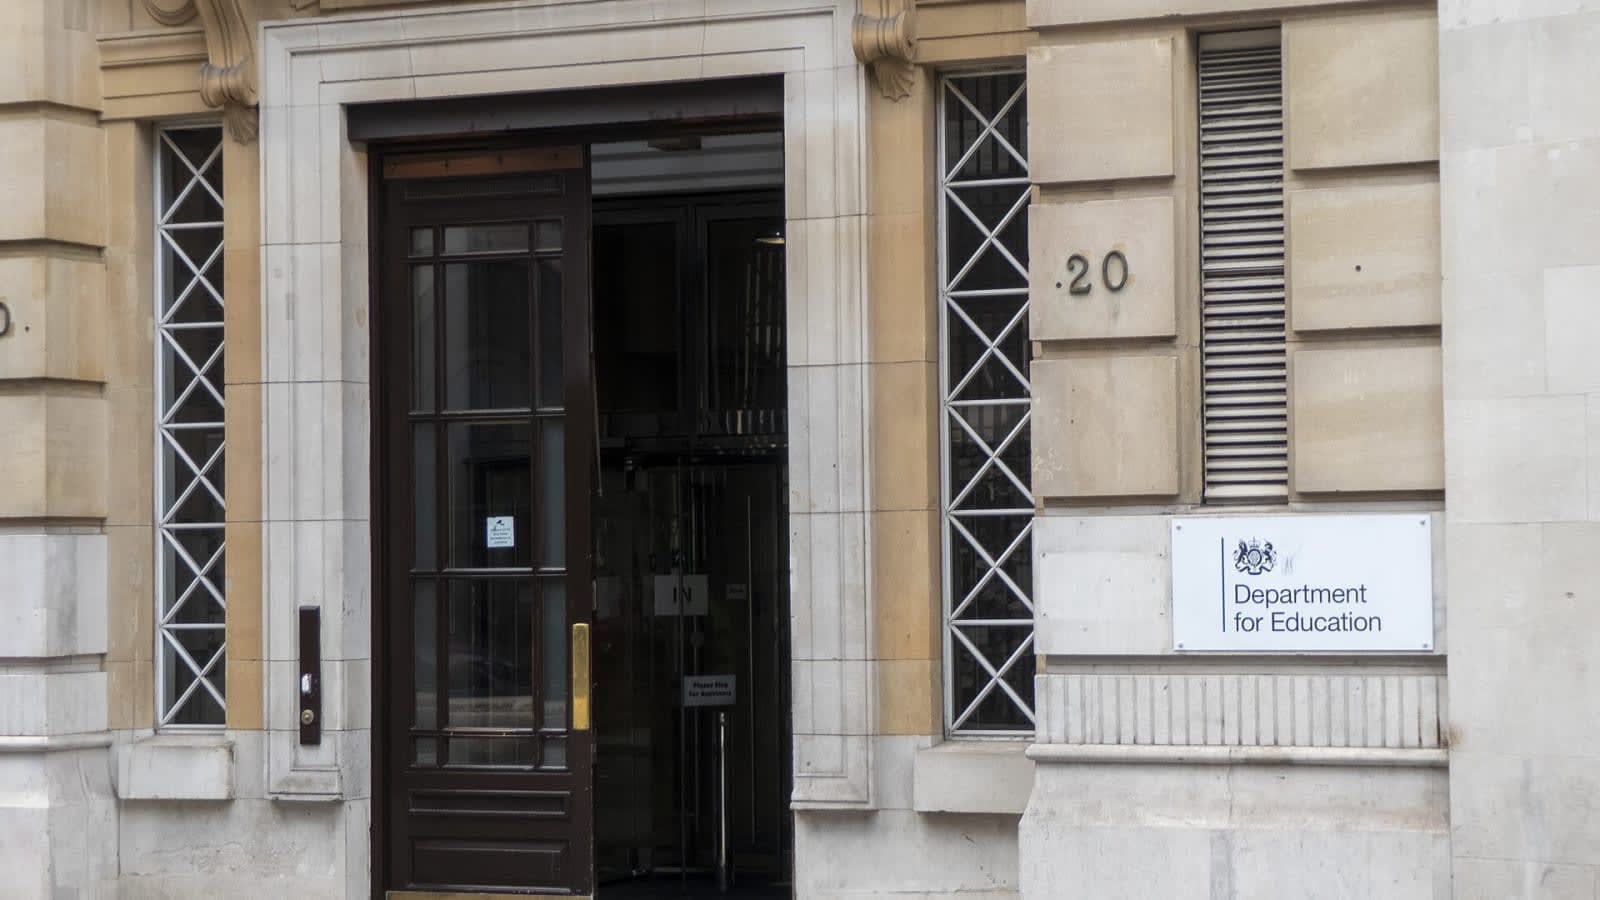
In England, the process starts with the National Funding Formula. This system, run by the Department for Education, begins with a basic allocation for every single child. Currently, the government sets a minimum funding level—approximately £4,610 for primary pupils and £5,771 for secondary pupils. If a school only received this baseline, however, it would struggle to stay open.
How the weighting factors work
The real divergence begins with the extra layers added on top of that baseline. The formula applies several different weightings, which act as multipliers. The largest of these is for socio-economic deprivation.
Schools receive additional cash for every pupil eligible for free school meals, or those living in neighbourhoods defined as deprived by national indices. The reasoning is straightforward: children from poorer backgrounds often require more resources to achieve the same academic results. They may need extra literacy support, subsidised uniform costs, or pastoral care that schools in wealthier areas do not have to provide.
Language and mobility
Other factors quickly compound the difference. English as an additional language (EAL) is a major variable. A school receives extra funding for any pupil who has entered the state system within the last three years and does not speak English as their first language. This money pays for intensive language support staff and bilingual learning resources.
Then there is "pupil mobility" — a measure of how many children join or leave a school mid-year. High turnover is expensive. It requires constant administration, diagnostic testing for new arrivals, and teacher time spent helping children catch up. Schools with high mobility rates get extra funding to cushion this administrative shock.
The cost of special needs
The most significant financial driver, however, is Special Educational Needs and Disabilities (SEND). While the national formula includes a small amount of "notional" SEND funding for mild learning difficulties, pupils with complex needs require an Education, Health and Care Plan (EHCP).
The funding for these plans comes from a separate high-needs budget, administered by local authorities. When a school takes on a pupil with severe physical or cognitive disabilities, the associated funding can run into tens of thousands of pounds. This money goes directly toward one-to-one teaching assistants, specialised equipment, and speech therapy. Consequently, a school that has built a strong reputation for SEND provision will naturally have a much higher overall budget than a school down the road with fewer high-needs pupils.
Why this system causes friction
While the logic behind weighting is widely accepted by education experts, it creates intense friction on the ground. Headteachers of schools in wealthier suburbs frequently point out that their baseline funding does not cover their fixed costs. A school with low deprivation indicators still has to pay the same utility bills, maintain the same roof, and pay experienced teachers the same salaries as a high-deprivation school, but with far less money in the bank.
On the other hand, campaigners argue that the current weightings still do not go far enough. They point out that the rising cost of specialist SEND support routinely outstrips the extra funding allocated, forcing schools to raid their general budgets to cover the shortfall. The result is a system where everyone feels short-changed, even as the spreadsheets show some schools receiving twice as much cash as their neighbours.
Key numbers
- £4,610
- £5,771


